

Inspect browser console
For errors that cannot be investigated with a screenshot of your site or the Builder, it may be necessary to open the browser console.
- Go to the page where the error appears and hit F12 on your keyboard to open Developer Tools.
- Click the Console tab if it is not already selected. This is the same for both Chrome and Firefox.
- If there appears to be a large amount of code under the Console tab accompanied by a scrollbar, you have the option of enlarging the dock to full screen. For Chrome, click the dotted line near the X to expand the 'Dock side' option and click the icon for 'separate window'.
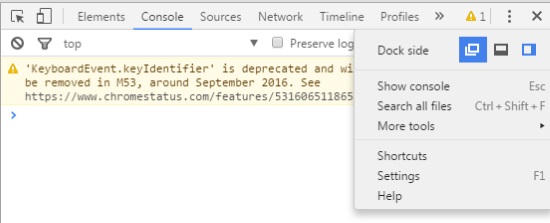
For Firefox, click the 'separate window' icon near the X.
- Reload the page by hitting F5 or by clicking the reload button to the left of your browser's address bar.
- Take a screenshot of the entire browser, including the address bar as well as the console. Send your screenshot(s) to a Support agent as an email attachment.
More information on browser consoles:
Chrome
https://developers.google.com/web/tools/chrome-devtools/debug/console/?hl=en
Firefox
https://developer.mozilla.org/en-US/docs/Tools/Browser_Console